24 Powerful Candlestick Patterns in Stock Market (with PDF Download)
If you’re a beginner in the share market, then the first step is to learn chart analysis, aka technical analysis.
Charts form with candlesticks, so it’s essential to identify some candlesticks and understand the psychology behind their formation.
If you can master the candlestick patterns, nobody can stop you from making huge profits in the stock market.
In this guide, I’ll teach you some of the most powerful candlesticks and strengths of buyers and sellers behind their formation.
I have also provided a candlesticks pdf download link so you can take its printouts and stick them in front of your trading setup.
24 Powerful Candlestick Patterns PDF Download
| File Name | Most Powerful Candlestick Patterns By Bullish Zone |
| File Type | |
| File Size | 328 Kb |
| Download Link | Click Here to Download |
Also Read: What is Support and Resistance
Most Powerful Candlestick Patterns To Catch Trend Reversal
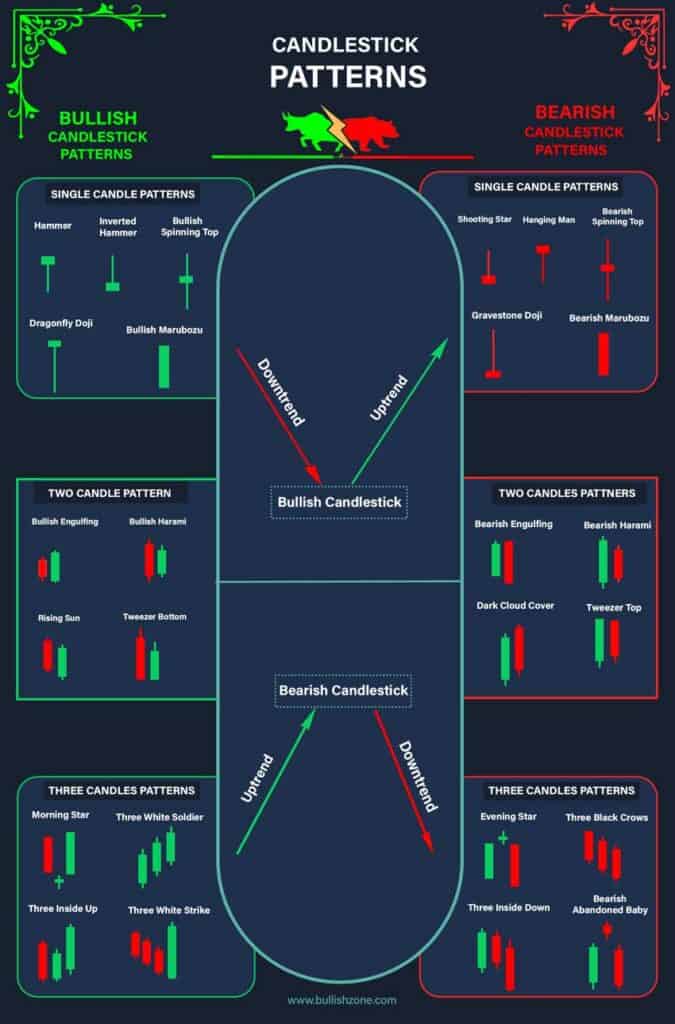
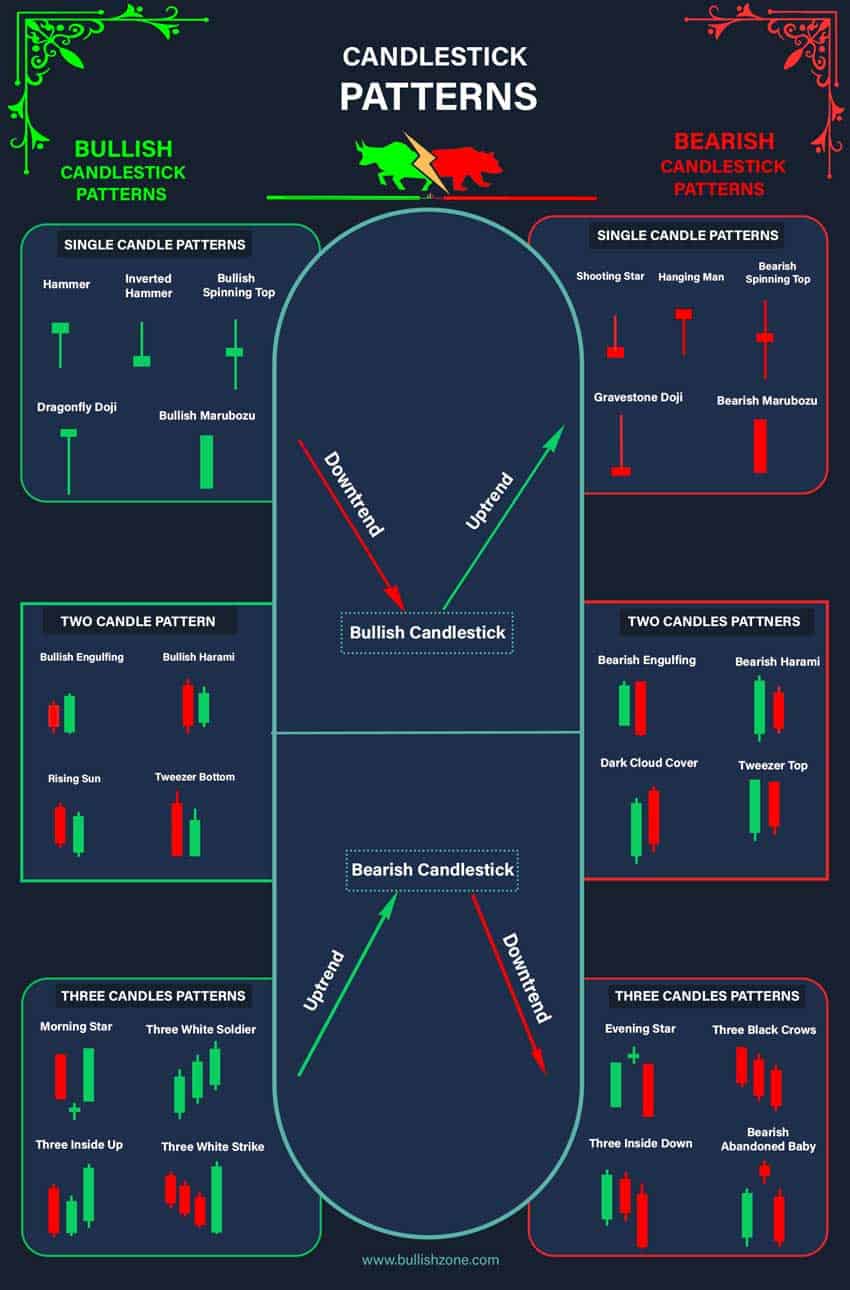
Here are some of the most powerful candlestick patterns that indicate trend reversal and continuations in various market conditions.
In order to make it beginner-friendly and memorable, I’ve segregated them into single, double, triple, bullish, and bearish candlesticks.
Bullish Reversal Single Candlestick Patterns
There are four main types of single candlestick patterns that indicate the reversal of a downtrend into an uptrend.
Here are some of the most powerful bullish reveal candlestick:
1. Hammer Candlestick
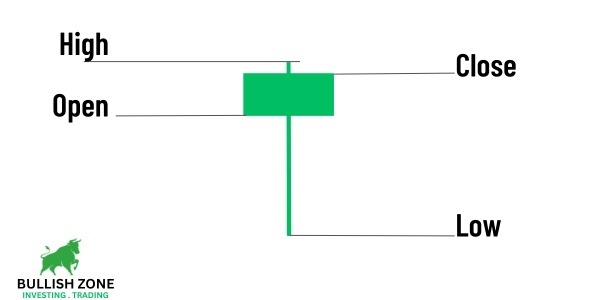
As the name suggests, the Hammer candlestick looks similar to a hammer. It has a small body and a long wick.
Hammer candlestick is a sign of bullish reversal.
If the stock price continuously falls and at the button, a hammer candlestick is formed, which means bears have tried to continue the downtrend, but bulls gave a tough fight.
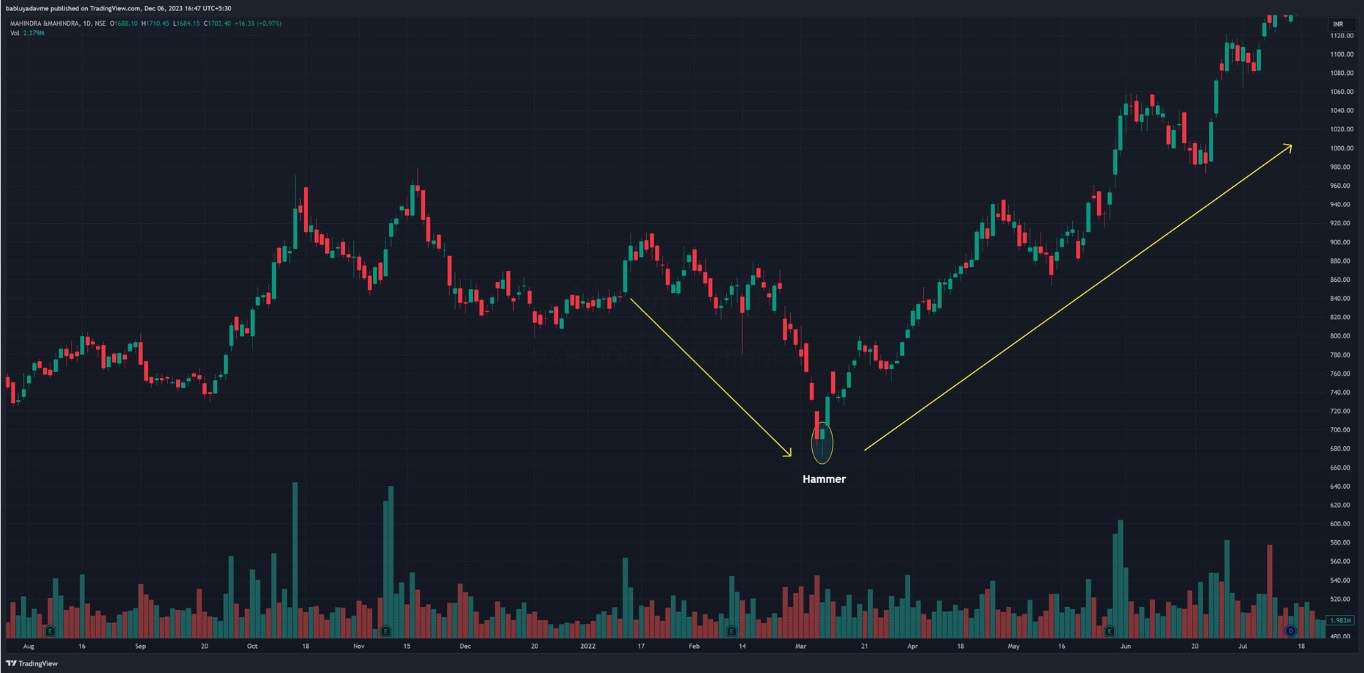
Hammer is one of my favorite candlestick patterns to catch the trend reversal in swing trades. I also trade this candlestick in intraday when it meets certain conditions.
How to Trade Hammer Candlestick?
- Trend: Downtrend
- Minimum Fall: 50% of previous uptrend
- Entry: When the next candle crosses the high of the Hammer candle
- Stoploss: Low of Hammer candlestick
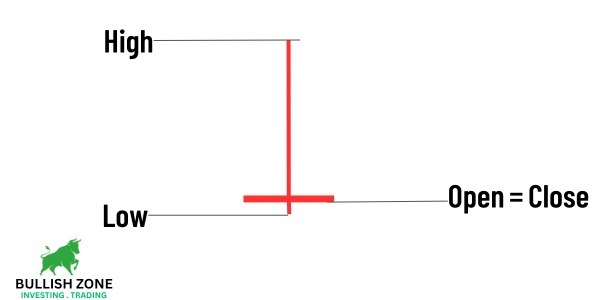
2. Dragonfly Doji Candlestick
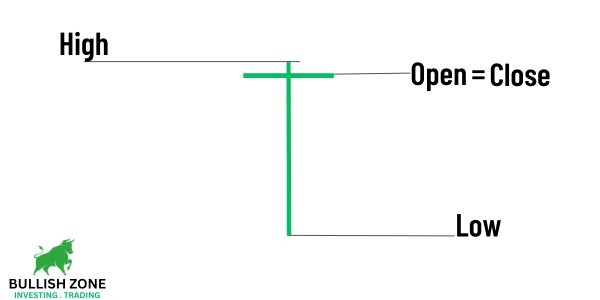
Dragonfly Doji candlestick pattern suggests a potential reversal from a downtrend to an uptrend, indicating that buyers are gaining strength.
Dragonfly Doji candlestick has a long wick and negligible body, which resembles similar to “T.”
Its open and closing prices are almost the same, indicating sellers tried to lower the share price, but buyers controlled and closed near the opening price.
How to Trade Dragonfly Doji Candlestick?
- Trend: Downtrend
- Minimum Fall: 40% to 50% of previous uptrend
- Entry: When the next candle crosses the high of the Doji candle
- Stoploss: Low of Doji candlestick
3. Bullish Marubozu Candlestick
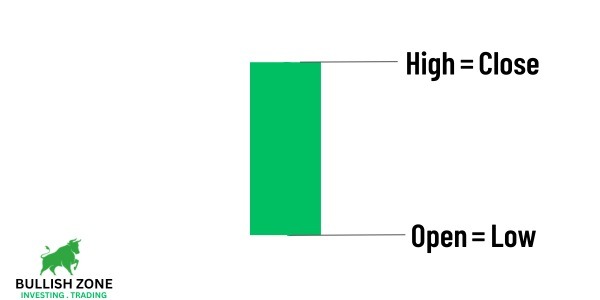
The Bullish Marubozu is a strong, positive candlestick pattern in the share market. It’s a long, solid body with no shadows, indicating the price opened low and closed high.
This candlestick pattern suggests buyers fully controlled the market from start to finish, pushing prices upward throughout the trading session.
How to Trade Bullish Marubozu Candlestick?
- Trend: Downtrend
- Minimum Fall: 30% of the previous uptrend
- Entry: When the next candle crosses the high of the Marubozu candle
- Stoploss: Low or open price of Marubozu candlestick
4. Inverted Hammer Candlestick
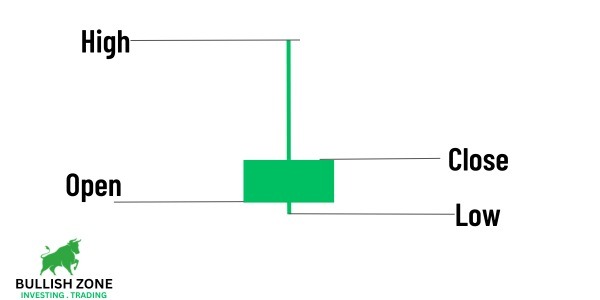
The Inverted Hammer Candlestick is a trading pattern signaling a potential bullish reversal.
It features a minor lower body with a long upper shadow and little or no lower shadow, resembling an upside-down hammer.
This pattern indicates that, despite selling pressure during the session, buyers were able to push prices up, hinting at a possible upward trend shift in the market.
How to Trade Inverted Hammer Candlestick?
- Trend: Downtrend
- Minimum Fall: 60% of the previous uptrend
- Entry: When the next candle closes above the heigh of the Inverted Hammer candle
- Stoploss: Low price of Inverted Hammer candlestick
5. Doji Candlestick
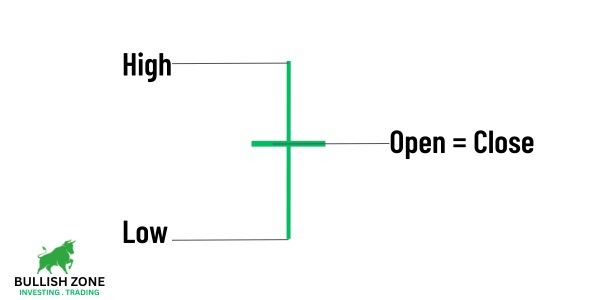
The Doji Candlestick is a unique pattern in trading, with long wick on the upper and lower sides, indicating that the opening and closing prices are almost equal.
Its appearance signifies indecision in the market, with neither buyers nor sellers gaining ground.
This pattern often signals a potential change in market direction, making it a critical signal for traders to watch.
How to Trade Doji Candlestick?
- Trend: Downtrend
- Minimum Fall: 60% of the previous uptrend
- Entry: When the next candle closes above the Doji candle
- Stoploss: Low price of Doji candlestick
Bearish Reversal Single Candlestick Patterns
Important Note: Always look for these candlestick patterns in an uptrend.
6. Shooting Star Candlestick

The Shooting Star Candlestick is a bearish reversal pattern in trading that forms on top of an uptrend.
It is similar to the Hammer candlestick, but the Japanese people named it a shooting star when it formed at the top of the uptrend.
This pattern indicates that buyers initially pushed prices up, but sellers regained control and drove prices down.
It often signals a potential downward turn in the market, warning traders to exit positions (sell-off the share) or make a short sell position.
How to Trade Shooting Star Candlestick?
- Trend: Uptrend
- Entry: When the next candle crosses low of the Shooting Star candle
- Stoploss: High price of Shooting Star candlestick
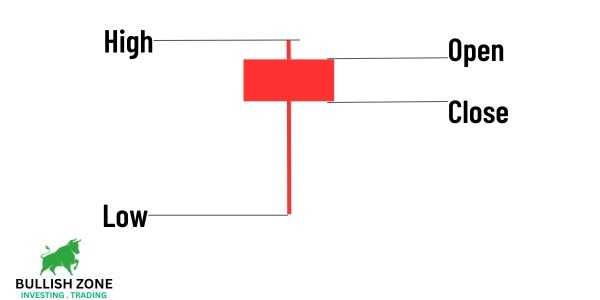
7. Bearish Marubozu Candlestick
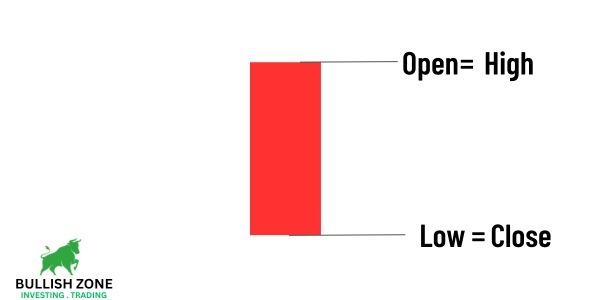
The Bearish Marubozu is a powerful, negative candlestick pattern in trading, characterized by a long, solid body with no shadows.
This indicates that the market opened high and closed low, with sellers dominating the entire session.
It’s a clear sign of strong bearish (downward) momentum, suggesting that prices may continue to fall, alerting traders to potential selling opportunities.
How to Trade Bearish Marubozu Candlestick?
- Trend: Uptrend
- Entry: When the next candle crosses the low of the Marubozu candle
- Stoploss: High price of Marubozu candlestick
8. Gravestone Doji Candlestick
The Gravestone Doji is a bearish candlestick pattern that signals potential market tops or reversals.
It resembles an upside-down “T,” with a long upper shadow and almost no lower shadow, indicating that the opening and closing prices are near the low of the session.
This pattern forms when buyers push the price up but fail to sustain the rise, allowing sellers to bring prices back down.
It’s often seen as a warning for traders that bullish momentum is waning and a downturn may be imminent.
How to Trade Gravestone Doji Candlestick?
- Trend: Uptrend
- Entry: When the next candle crosses the low of the Doji candle
- Stoploss: High price of Doji candlestick
9. Hanging Man Candlestick
The Hanging Man Candlestick is a bearish reversal pattern in trading, indicating a potential market downturn.
This pattern has a small upper body with a long lower shadow and little or no upper shadow, suggesting that sellers are putting their effort into bringing the price down.
The Hanging Man warns traders that bullish momentum may be fading, possibly leading to a price decline.
How to Trade Hanging Man Candlestick?
- Trend: Uptrend
- Entry: When the next candle closes below the low of the Hanging Man candle
- Stoploss: High price of Hanging Man candlestick
10. Bearish Spinning Top Candlestick
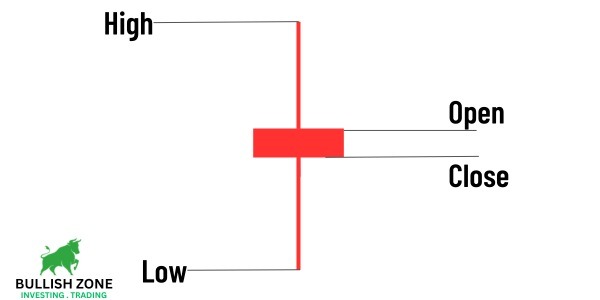
The Bearish Spinning Top is a candlestick pattern in chart analysis that shows the almost equal effort of bulls and bears.
It features a small body with both upper and lower shadows of relatively equal length, resembling a spinning top.
This pattern shows a balanced fight between buyers and sellers, but occurring in a downtrend, it suggests that the bearish sentiment may continue.
How to Trade Spinning Top Candlestick?
- Trend: Uptrend
- Entry: When the next candle closes below the low of the Spinning Top candle
- Stoploss: High price of Spinning Top candlestick
Bullish Reversal Double Candlestick Patterns
Important Note: Always look for these candlestick patterns in a downtrend.
11. Bullish Engulfing Candlestick
Bullish Engulfing consists of two candles: the first, small and bearish, fully ‘engulfed’ by the second, larger bullish candle.
This candlestick pattern shows that buying momentum has overtaken selling pressure, often signaling the start of an upward trend.
It’s one of the most powerful candlestick patterns that indicates a downtrend is shifting into an uptrend.
How to Trade Bullish Engulfing Candlestick?
- Trend: Downtrend
- Entry: When the next candle crosses the high of the Engulfing candle.
- Stoploss: Low of Engulfing candlestick
12. Tweezer Bottom Candlestick
The Tweezer Bottom Candlestick is a bullish reversal pattern in trading, often signaling the end of a downtrend and the start of an upward move.
It consists of two or more candlesticks with matching bottom prices, resembling a pair of tweezers.
This pattern indicates a strong support level where selling pressure is exhausted, bulls begin to take control, and the downtrend will shift into an uptrend.
How to Trade Tweezer Bottom Candlestick?
- Trend: Downtrend
- Entry: When the next candle crosses the high of the previous two candles
- Stoploss: Low of Tweezer Bottom candlestick
13. Bullish Harami Candlestick
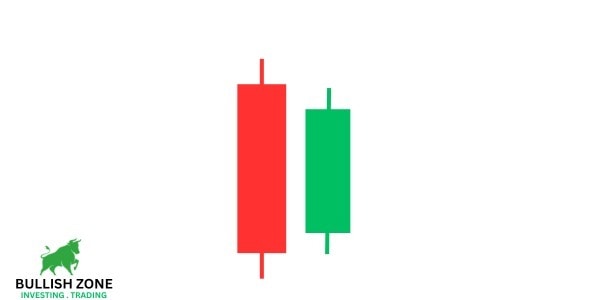
The name might be funny for Indian traders, but Japanese people gave this name.
Bullish Harami is a candlestick pattern in trading, signaling a potential reversal from a bearish to a bullish trend.
It consists of two candles: the first is a large bearish candle (mother candle), followed by a smaller bullish candle (baby candle) completely contained within the range of the first.
This pattern suggests that selling pressure is diminishing, and buyers are starting to gain control, indicating a possible shift towards upward market movement.
How to Trade Bullish Harami Candlestick?
- Trend: Downtrend
- Entry: When the next candle closes above the high of the mother candle
- Stoploss: Low of mother candlestick
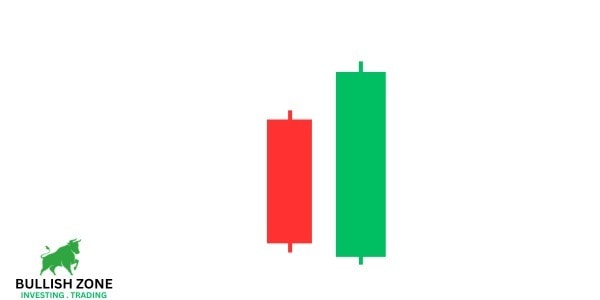
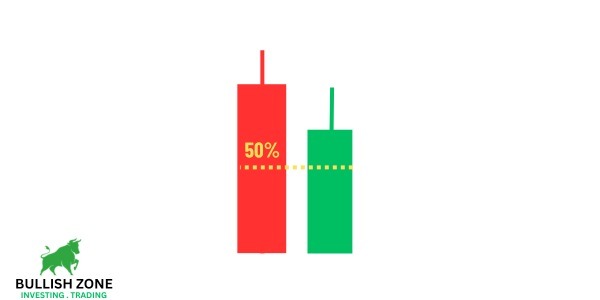
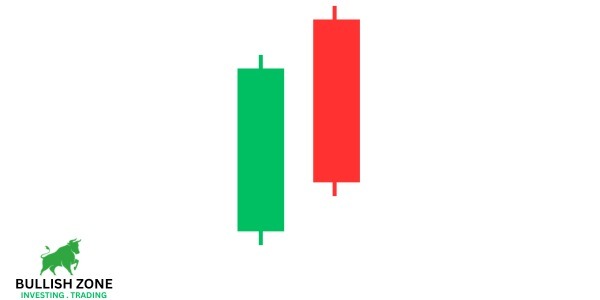
14. Rising Sun Candlestick
Rising Sun is a bullish reversal candlestick pattern that indicates that the downtrend is going to shift into an uptrend.
From the image shown above, you can see a strong bearish candle, while the next candle has a gap down opening, but still, it covered 50% of the bearish candle, which indicates buyers control the downfall.
How to Trade Rising Sun Candlestick?
- Trend: Downtrend
- Entry: When the next candle closes above the high of the red candle
- Stoploss: Low of red candlestick
Bearish Reversal Double Candlestick Patterns
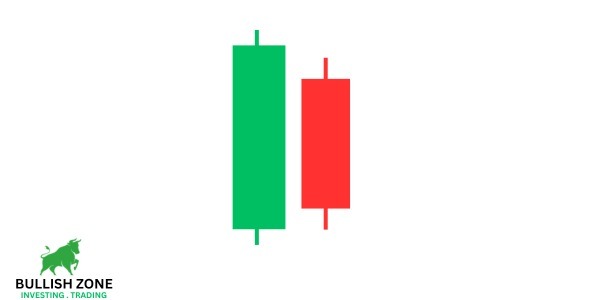
15. Bearish Engulfing Candlestick
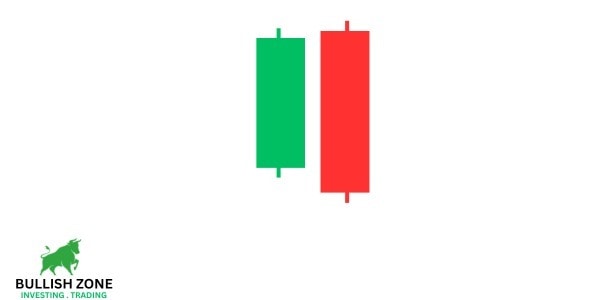
Bearish Engulfing indicates the control of sellers in an uptrend, and the market can reverse its trend.
If a strong bullish candle in an uptrend is completely engulfed (eaten) by a bearish candle, it’s known as Bearish Engulfing candlestick.
If you try to understand the psychology behind this candlestick formation, then you’ll find that bulls tend to continue the uptrend but bear control in the next candle.
It’s one of my favorite candlesticks that works 90% of the time during intraday trades.
How to Trade Bearish Engulfing Candlestick?
- Trend: Uptrend
- Entry: When the next candle crosses the low of the bearish candle
- Stoploss: High of bearish candlestick
16. Tweezer Top Candlestick
The Tweezer Top Candlestick is a bearish reversal pattern, often signaling the end of an uptrend.
It consists of two or more candlesticks with matching top prices, resembling a pair of tweezers.
This pattern indicates strong resistance, where buying pressure is overcome by sellers, suggesting a potential shift from bullish to bearish market trends.
How to Trade Tweezer Top Candlestick?
- Trend: Uptrend
- Entry: When the next candle crosses 50% of the previous bullish candle
- Stoploss: High of Tweezer top candlestick
17. Bearish Harami Candlestick
It’s the opposite of the Bullish Harami candlestick. Bearish Harami candlestick forms on the top of the uptrend and indicates a potential trend reversal.
How to Trade Bearish Harami Candlestick?
- Trend: Uptrend
- Entry: When the next candle crosses the previous bullish candle
- Stoploss: High of bullish candlestick
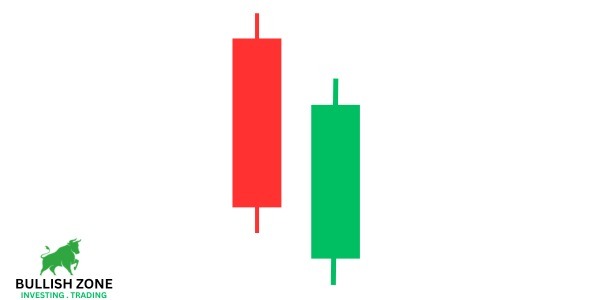
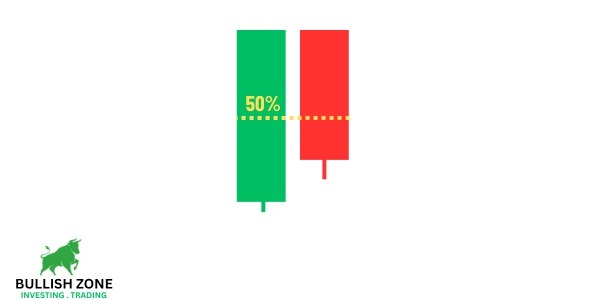
18. Dark Could Cover Candlestick
As the name suggests, Dark Cloud indicates a potential shift from an uptrend to a downtrend.
Dark Cloud Cover is the opposite of Rising Sun candlestick. It has a strong bullish candle and a strong bearish candle after the gap-up opening.
It indicates that bears won the fight and controlled the share price instead of gap-up opening.
How to Trade Dark Cloud Cover Candlestick?
- Trend: Uptrend
- Entry: When the next candle crosses the previous bullish candle
- Stoploss: High of bearish candlestick
Bullish Reversal Three Candlestick Patterns
19. Morning Star Candlestick
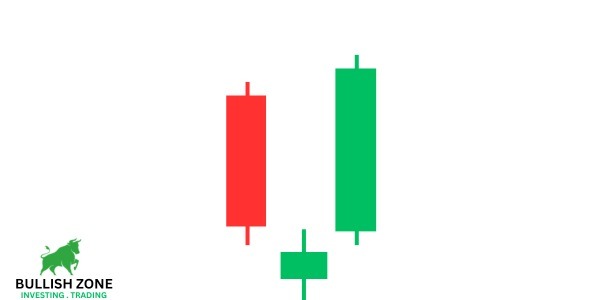
Morning Star is the most powerful and world-popular bullish reversal candlestick pattern that every buyer looks for.
It’s formed by three candles: a strong bearish candle, followed by a small star candle with a gap down opening, and a strong bullish candle with a gap up opening.
If you combine all three candles into a single candlestick, then it will form a hammer candle with a long shadow.
How to Trade Morning Star Candlestick?
- Trend: Downtrend
- Entry: When the next candle crosses the high of the bullish candle
- Stoploss: Low of star candle
20. Three White Soldiers Candlestick
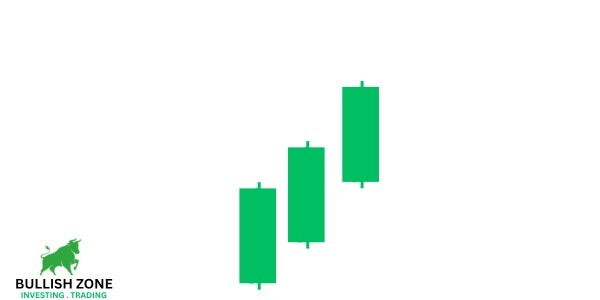
Three White Soldier consists of three consecutive long-bodied, bullish (white or green) candles, each opening within the previous candle’s body and closing at a higher level.
This pattern signifies a steady increase in buying pressure, indicating a reversal from a downtrend to an uptrend.
Traders often view the Three White Soldiers as a strong signal for potential buying opportunities and the start of a sustained bullish movement.
How to Trade Three White Soldiers Candlestick?
- Trend: Downtrend
- Entry: When the next candle crosses the high of the third bullish candle
- Stoploss: Low of first bullish candle
21. Three Inside Up Candlestick
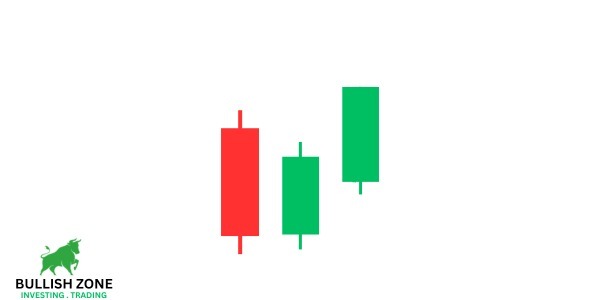
Three Inside Up is a three-candle formation appearing at the end of a downtrend. The first candle is a large bearish one, followed by a smaller bullish candle that closes within the body of the first.
The third candle is another bullish one that closes above the midpoint of the first candle’s body.
This pattern suggests a shift in momentum from bearish to bullish, indicating a potential upward trend.
How to Trade Three Inside Up Candlestick?
- Trend: Downtrend
- Entry: When the next candle crosses the high of the third bullish candle
- Stoploss: The lowest point of these three candles
Bearish Three Candlestick Patterns
22. Evening Star Candlestick
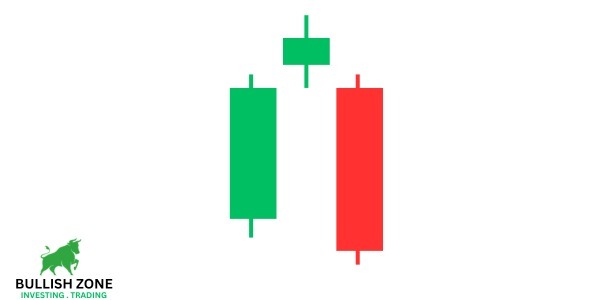
Evening Star is the opposite of the Morning Star candlestick, indicating a shift from an upward trend into a downtrend.
It’s a three-candle formation: the first is a large bullish candle, signaling ongoing upward momentum.
The second is a smaller candle (star candle), which could be either red or green, opening higher than the previous close and indicating market indecision.
The third is a bearish candle that closes well into the body of the first candle.
This pattern suggests a shift from bullish to bearish sentiment, signaling traders to consider selling opportunities or to be cautious with long positions.
How to Trade Evening Star Candlestick?
- Trend: Uptrend
- Entry: When the next candle crosses the low of the bearish candle
- Stoploss: High of star candle
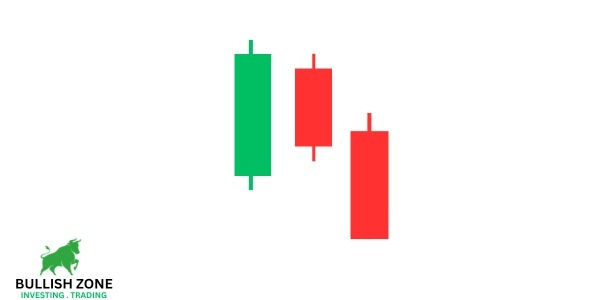
23. Three Black Crows Candlestick
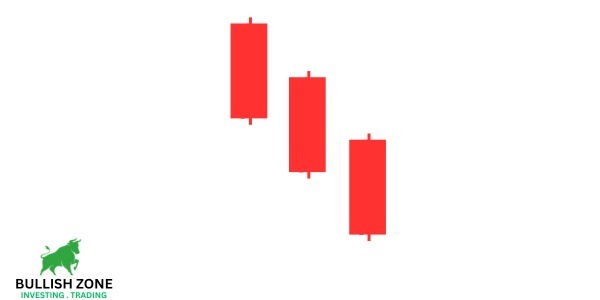
The Three Black Crows Candlestick pattern is a bearish reversal indicator, typically occurring at the end of an uptrend.
It consists of three consecutive long-bodied, bearish (black or red) candles, each opening within the previous candle’s body and closing at a lower level.
This pattern signifies a strong increase in selling pressure, indicating a reversal from an uptrend to a downtrend.
How to Trade Three Black Crows Candlestick?
- Trend: Uptrend
- Entry: When the next candle crosses the low of the third bearish candle
- Stoploss: High of the first bearish candle
24. Three Inside Down Candlestick
The Three Inside Down Candlestick pattern is a bearish reversal indicator in trading. It emerges at the end of an uptrend and consists of three candles.
The first is a large bullish candle, followed by a smaller bearish candle that closes within the body of the first.
The third candle is another bearish one, closing below the midpoint of the first candle’s body.
This pattern indicates a shift in momentum from bullish to bearish, suggesting a potential downward trend.
How to Trade Three Inside Down Candlestick?
- Trend: Uptrend
- Entry: When the next candle crosses the low of the third bearish candle
- Stoploss: The highest point of these three candles
Conclusion
These are the most popular candlestick patterns that indicate trend reversal. Please note that the significance of these candlesticks is only viable when they are formed on the top and bottom of a trend.
If you trade these candlesticks with proper risk management and strict stoploss, then you can generate a good profit in swing and intraday trades.