What is Support and Resistance in Stock Market? – (A Beginner’s Guide)
If you’re learning technical analysis to understand the stock market behavior, then support and resistance are fundamental concepts.
Support and resistance levels decide the next move in the market. Millions of retail traders and institutional investors follow major support and resistance concepts.
In this guide, you’ll learn what support and resistance are and how to trade. I’ll also explain the different types of support and resistance that continuously formed in the stock market.
What is the Support Level?
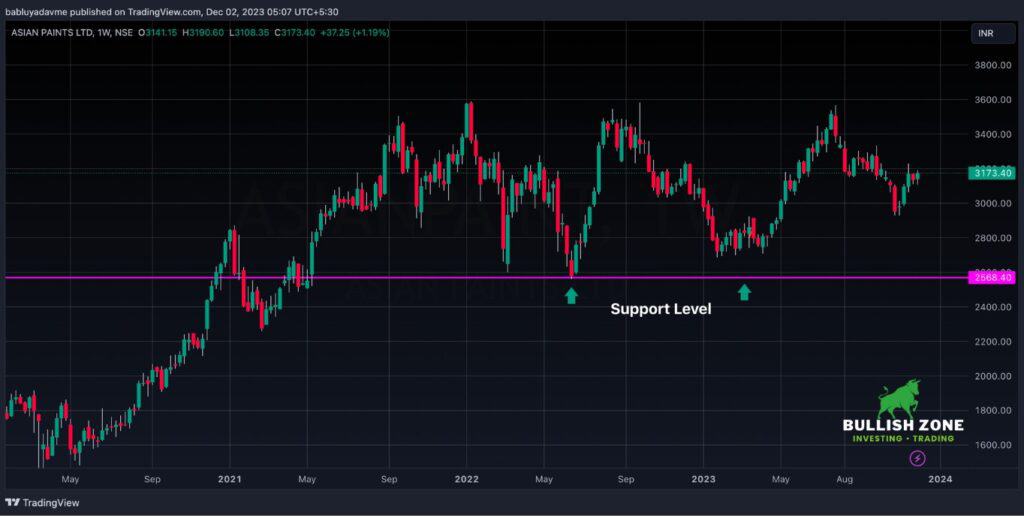
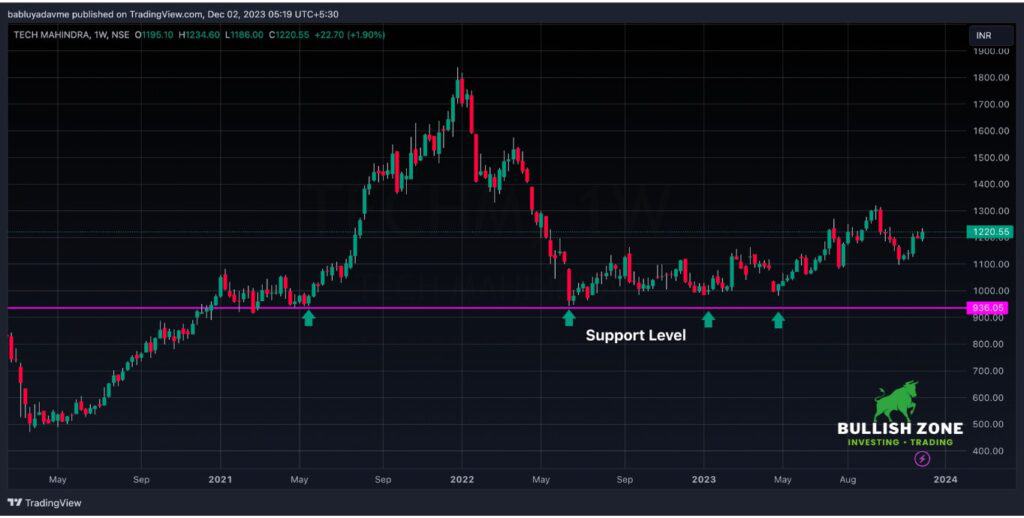
As the name suggests, support prevents the stock price from falling further down. This is the level where the maximum number of buyers waiting to buy the shares.
In other words, support is also known as the “demand zone.” It means the buyers are ready to buy the shares at that discounted price.
Let’s understand the support level with an example…
Suppose there are three apartments adjacent to each other; the first one has seven floors, the second one has five floors, and the third one has three floors.
If you drop a rubber ball from the seventh floor, how low will it go? The fifth floor.
As soon as it hits the floor, the rubber ball will jump up. Which means the fifth floor acts as a support.
This is how the support level in the stock market works. The support level is always below the current stock price.
If a stock is in an uptrend, many buyers who missed the trend will wait for the support level to buy.
Some examples of support levels:
- Asian Paints Weekly Chart
- Tech Mahindra Weekly Chart
What is the Resistance Level?
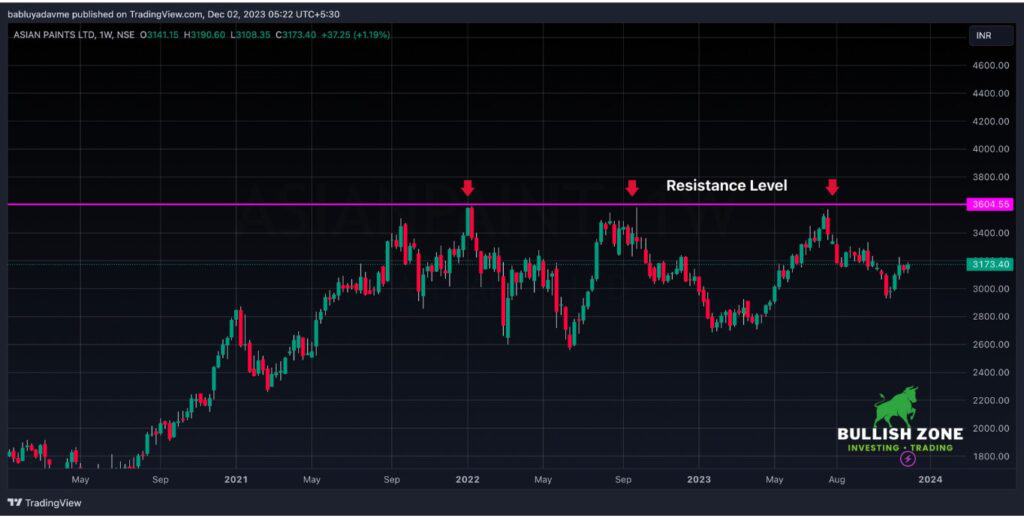
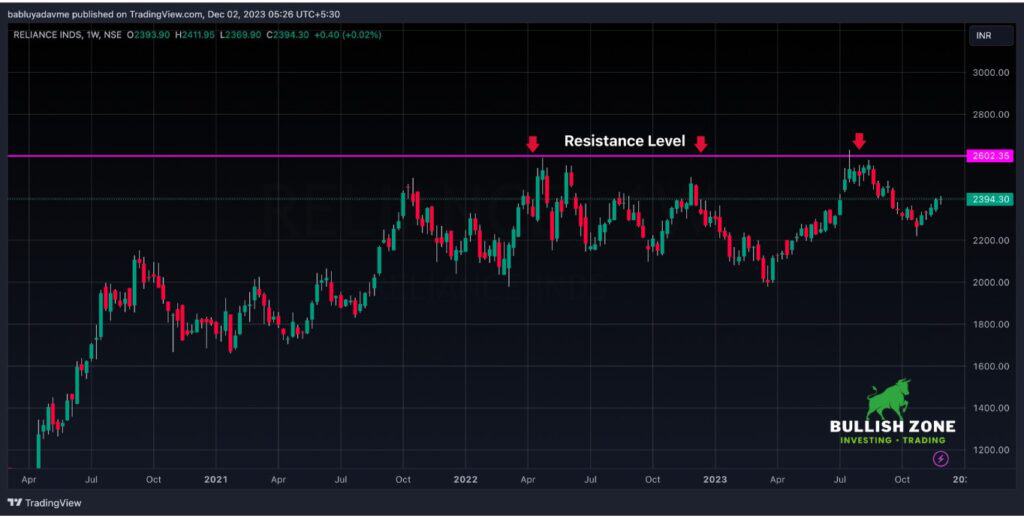
As the name suggests, the resistance level is something that prevents stock prices from going further up.
This is the level where the maximum number of traders are waiting to exit their positions or make short-sell positions.
In other words, a resistance level is also known as the “supply zone.” So, it’s essential to keep in mind that the resistance level is always above the current stock price.
Let’s understand resistance level with an example…
If you throw up a rubber ball in a room, how up will it go? The ceilings, right? As soon as it hits the ceiling, the ball will come down.
So, the ceiling of your room is acting as a resistance. Likewise, if a market is in a downtrend, there are higher chances that its previous swing high will serve as a resistance, and the price will fall again.
Some examples of resistance levels:
- Asian Paints Weekly Chart
- Reliance Industries Weekly Chart
How Do I Trade Support and Resistance Levels in the Stock Market?
If you’re a beginner, the most straightforward trading strategy would be to buy near the support zone and sell near the resistance zone.
Here’s how I plan to swing trade based on support and resistance levels-
Rules:
- Stock must be in an Uptrend.
- The timeframe must be daily.
- Only trade in NIFTY 50 or Midcap NIFTY stocks.
Steps:
- Draw the support and resistance levels.
- Monitor the behaviors of stock prices near the support level.
- Wait for bullish candlestick formations like Engulfing, Marubozu, Hammer, or Dragonfly Doji.
- Your stop loss should be below the support zone, and the target should be 1:2, 1:3, or the next resistance level.
- Decide your maximum risk in that trade.
- Plan the quantity according to maximum risk appetite.
5 Types of Support and Resistance That Works in the Stock Market
There are various types of support and resistance, but five out of them work great. Here are five different types of support and resistance (S&R) that work great in the stock market:
1. Demand and Supply Zone
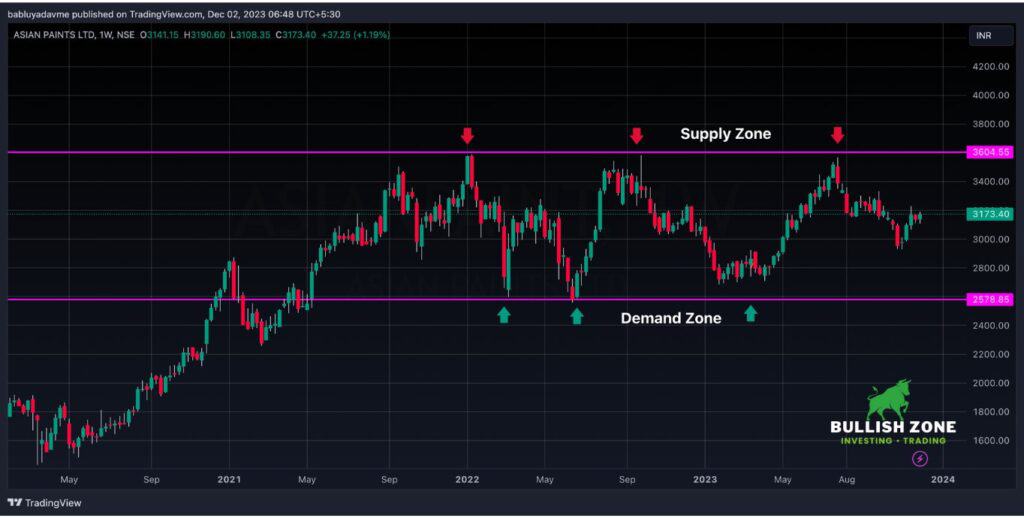
The simplest forms of support and resistance are demand and supply zones. As I explained above, the previous swing low in an uptrend will act as the support, and the previous swing high in a downtrend will act as the resistance level.
You can draw horizontal lines on the previous swing high and swing low. This is the most popular support and resistance level.
2. Trendline S&R
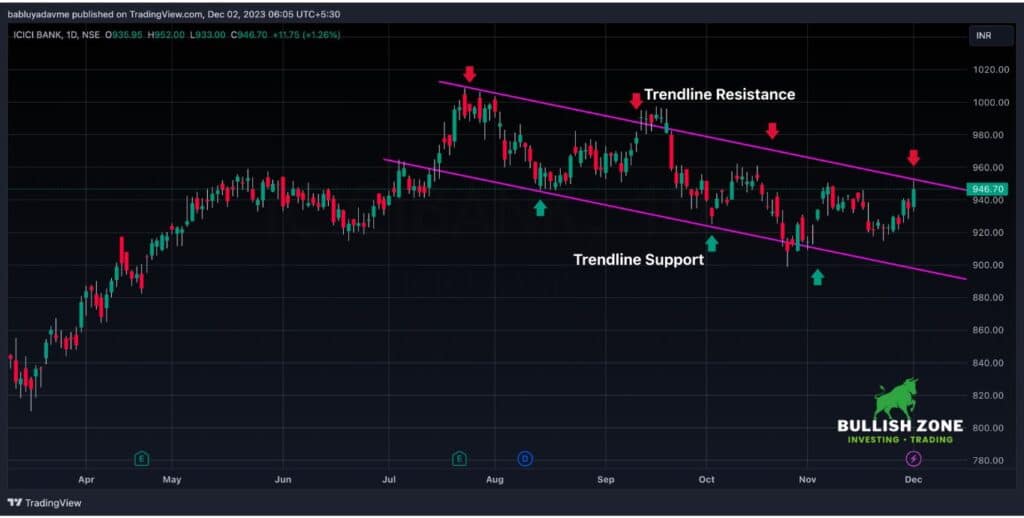
Support and resistance can also be drawn on trendlines and channels. In the daily chart of ICICI Bank, you can see that prices are moving within a channel.
The bottom part of the channel acts as support, and the upper part acts as resistance. So, you can plan a small trade within the channel.
As soon as the buyer pumps the price above the channel and with strong buying pressure, the sellers will cut their position, and the price will move upward.
This chart pattern is also known as the Flag pattern.
3. Round Number S&R
The next important support and resistance are round numbers. The simplest logic for round number support and resistance is human psychology.
A large number of market participants (buyers and sellers) place their stoplosses near the round numbers.
As the price sustains above or below the round numbers, these pending orders execute, and the market gives a directional move.
Round number S&R examples:
- Stock Price: 500, 1000, 1500, 2000, etc.
4. Fibonacci Numbers S&R
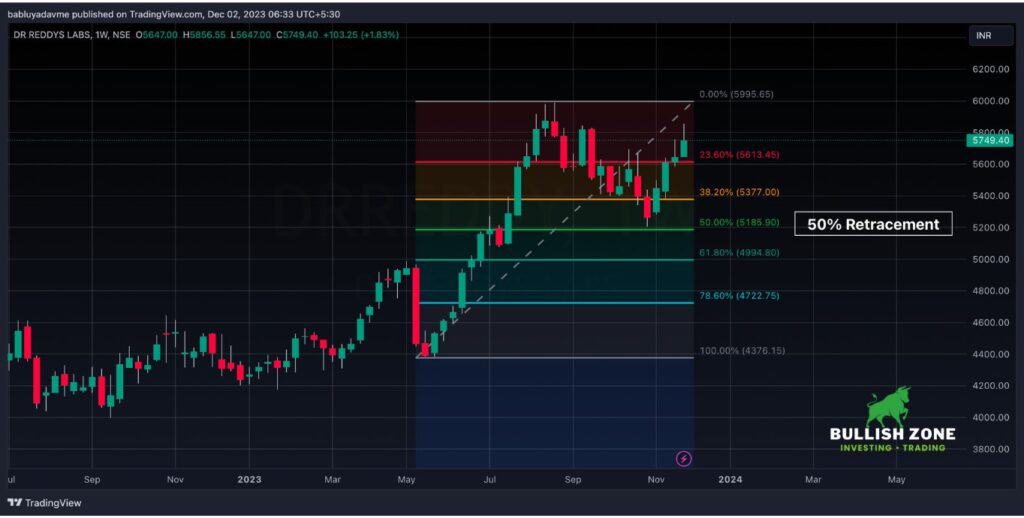
Fibonacci numbers are used to predict potential support and resistance levels based on the premise that markets often retrace a predictable portion of a move, after which they continue to move in the original direction.
Traders apply Fibonacci ratios – 23.6%, 38.2%, 61.8%, and sometimes 50%—to identify these levels on a chart, where price might reverse or continue, offering opportunities for strategic entry and exit points.
5. Indicator S&R
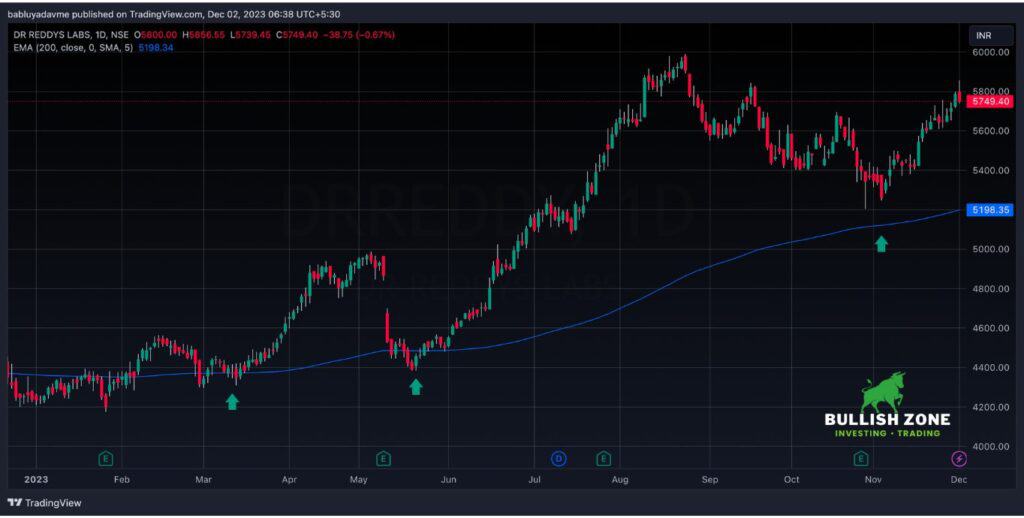
Technical indicators like 200-day Exponential Moving Average (EMA), Pivot Points, Bollinger Band, etc., act as strong support and resistance levels.
So, while planning any trade, you must consider these indicators to spot the important support and resistance levels.
Conclusion
Support and resistance levels are not only the foundation of technical analysis but also the battleground where the tug-of-war between buyers and sellers plays out, shaping the market’s future direction.
I hope you understand what support and resistance is and it’s different types. Feel free to ask your doubts in the comment box.