9 Most Profitable Chart Patterns in Bank Nifty (for Option Buying)
Bank Nifty represents the performance of banking sector stocks listed on the National Stock Exchange (NSE).
In the last couple of years, I have deeply analyzed the live charts of Bank Nifty and curated a list of the nine most successful patterns that frequently form.
If you’re an intraday trader and regularly trade in bank nifty futures and options (FNO), these patterns will increase your number of successful trades.
Are you ready to profit from bank nifty futures and options (FNO)? Trade these chart patterns with proper risk management and strict stoploss.
Also Check: Most Profitable Candlestick Patterns
Best Chart Patterns For Bank Nifty
Below, I have listed some of the most successful chart patterns for bank nifty options trading.
You can only make a huge profit if you strictly follow stop losses with proper risk management and rules.
I have also written some rules and risk management tips in this article. So, read the whole guide with full attention.
Bullish Chart Patterns
Bullish chart patterns suggest that the share price will continue to move up. It also indicates that the market is in control of buyers, and you should look for a buying opportunity.
1. Bullish Flag
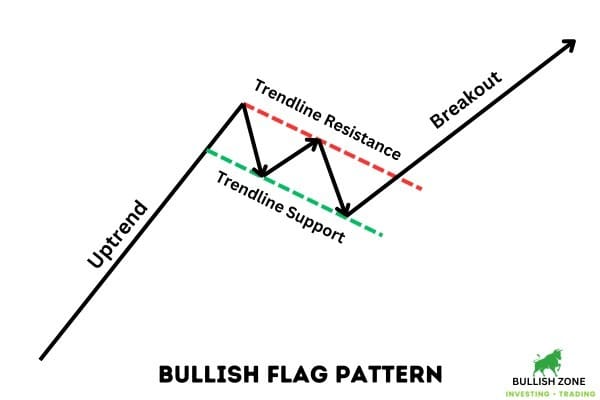
A bullish flag is one of the most profitable trend continuation chart patterns in an upward direction.
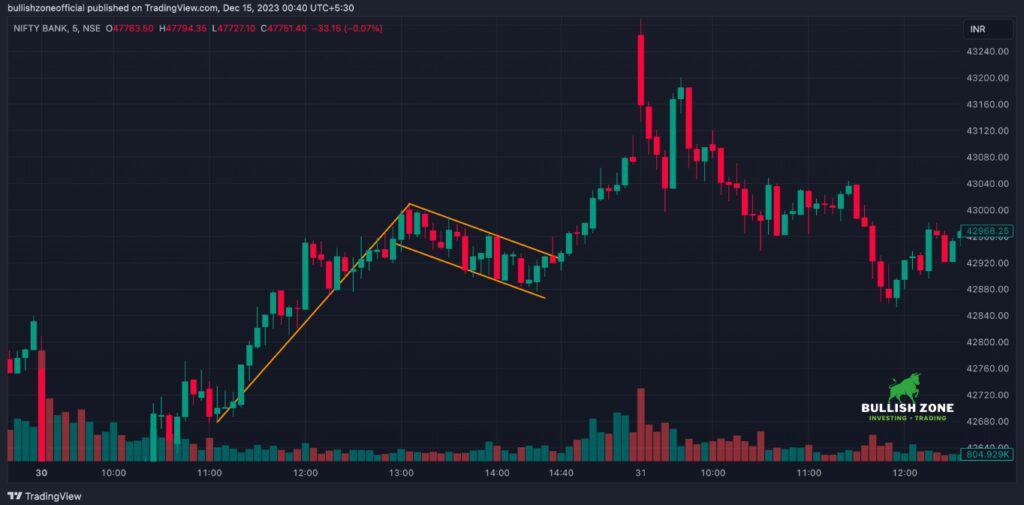
If you closely monitor the bank nifty chart in the live market, you’ll frequently see a bullish flag formation on different timeframes.
This chart pattern looks like a flag, so the traders named it a flag pattern. Some people also call it a flag and pole pattern.
2. Ascending Triangle
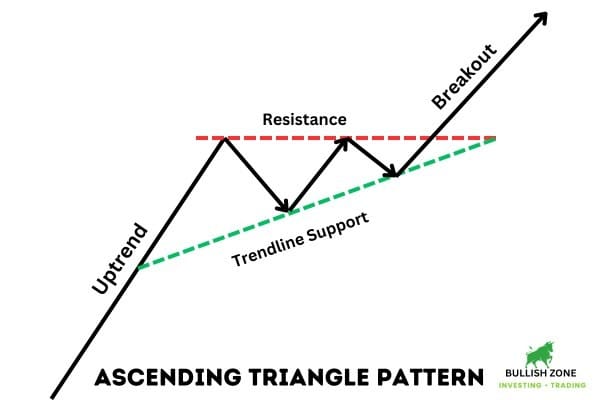
Bank Nifty often forms an ascending triangle chart pattern in an uptrend. It indicates a continuation of the trend in the bullish direction.
Resistance is formed on top in this chart pattern, but lows slowly increase. If you draw a horizontal line on the resistance level and join the lows with the trendline, it takes the form of an ascending triangle.
That’s why this pattern is known as the ascending triangle chart pattern.
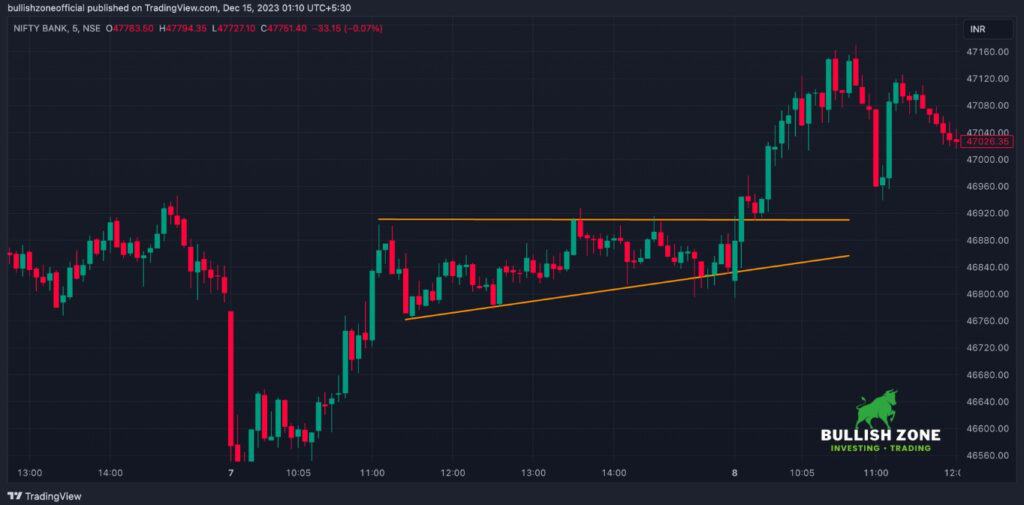
You can see the example of an ascending triangle pattern on a bank nifty chart in the 5-minute timeframe.
3. Bullish Rectangle
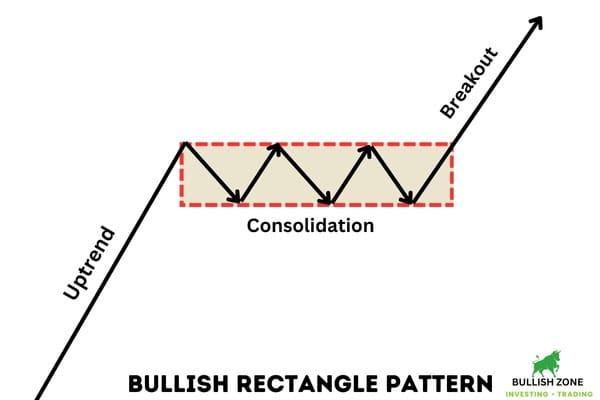
A bullish rectangle is a trend continuation pattern formed after a strong uptrend. When the price is bounded by parallel support and resistance level, it creates a rectangle.
I often see this pattern on bank nifty charts, in which buyers and sellers equally fight. It is also known as the consolidation period, and the options buyer must wait for breakout.
The options premium decreases (due to time decay) until the bank nifty breakout and sustains above the upper price level.
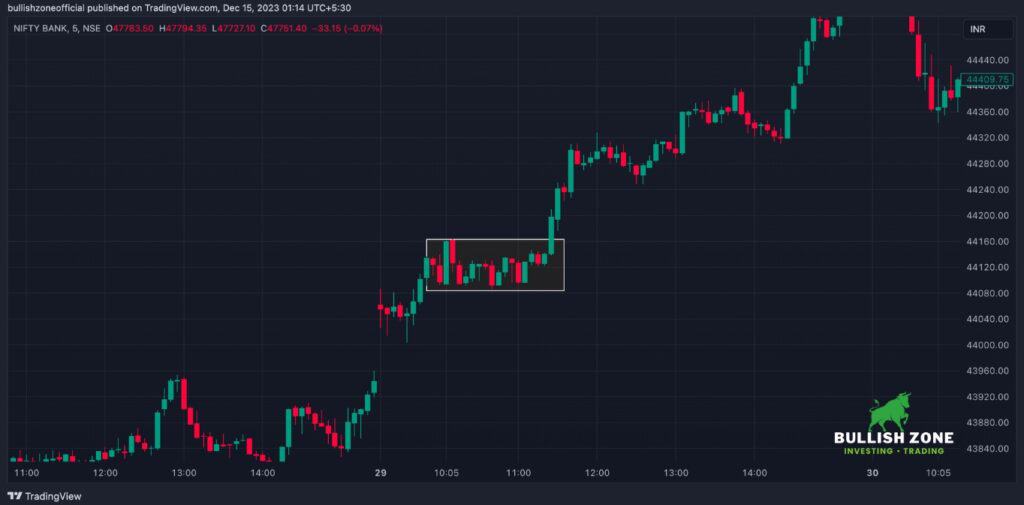
In the example above, you can see the price movement after the breakout of the rectangle pattern.
4. Double Bottom
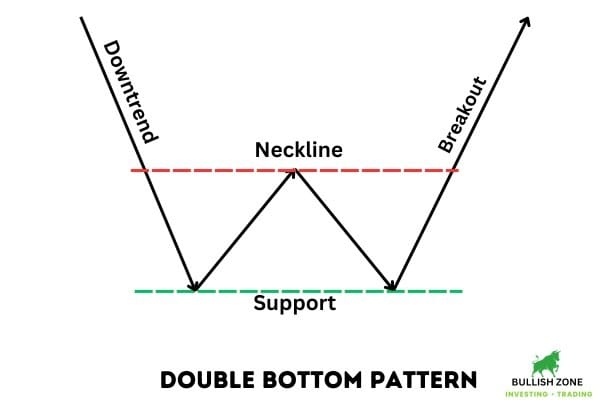
Double bottom is a trend reversal chart pattern that indicates the shifting of a downtrend into an uptrend.
This pattern is also known as the W pattern because it resembles the letter W. In the below image, you can see that the price formed a support level and bounced.
In the subsequent selling pressure, the bear failed to break that support level, and the buyer took control of the market.
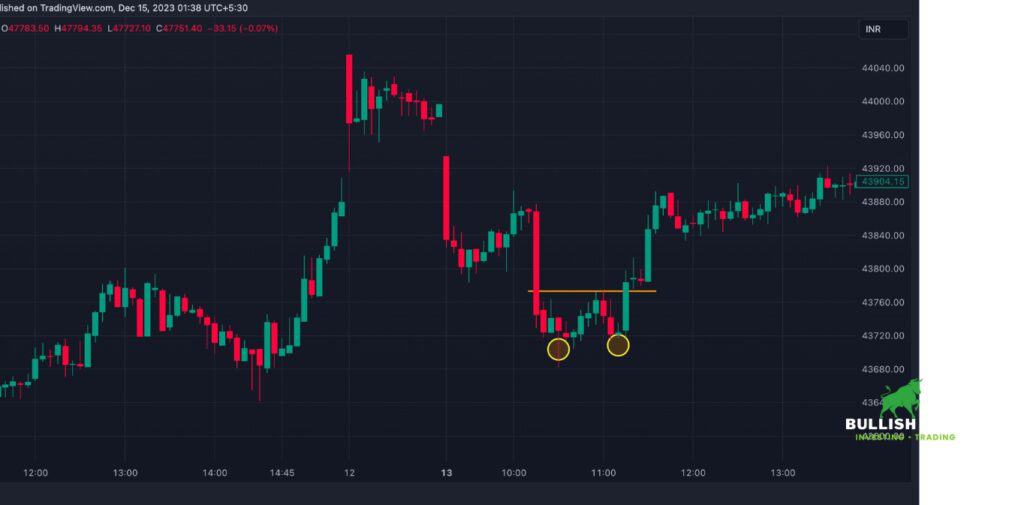
You’ll often see a double bottom chart pattern if you closely monitor the bank nifty chart on different timeframes.
5. Inverse Head and Shoulder
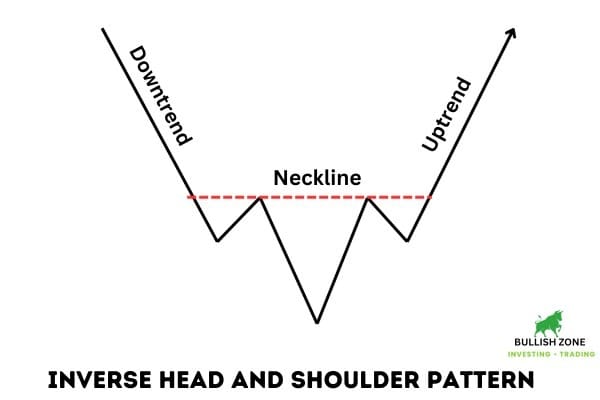
Inverse head and shoulder is a bullish reversal chart pattern with a higher risk-to-reward ratio.
The example below shows two lows at almost the same level and a deeper low between both.
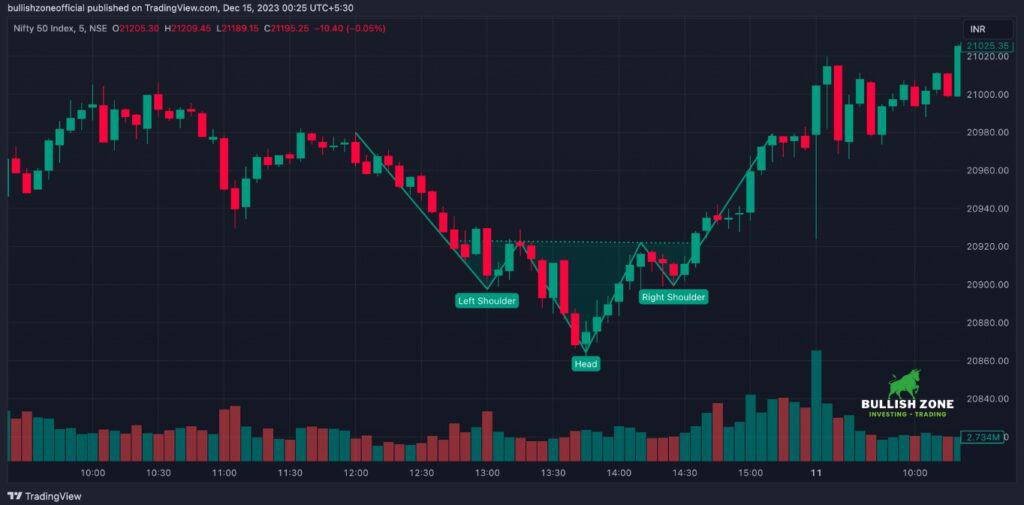
If you look at the resistance level, you can see all four are almost equal. When the price moves upward and sustains above the neckline, it will show a strong uptrend.
Bearish Chart Patterns
A bearish pattern suggests that the selling pressure will continue. In this situation, you should plan to buy put options (PE) or make a short position in the future.
6. Bearish Flag
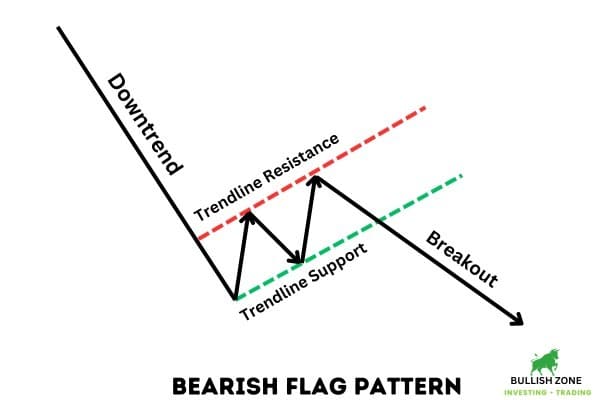
The bearish flag is the opposite of the bullish flag pattern. It shows a downtrend continuation, a highly profitable pattern in bank nifty FNO trading in intraday.
If you look at the example given below, you can see a strong downtrend, and then the price consolidates in a channel.
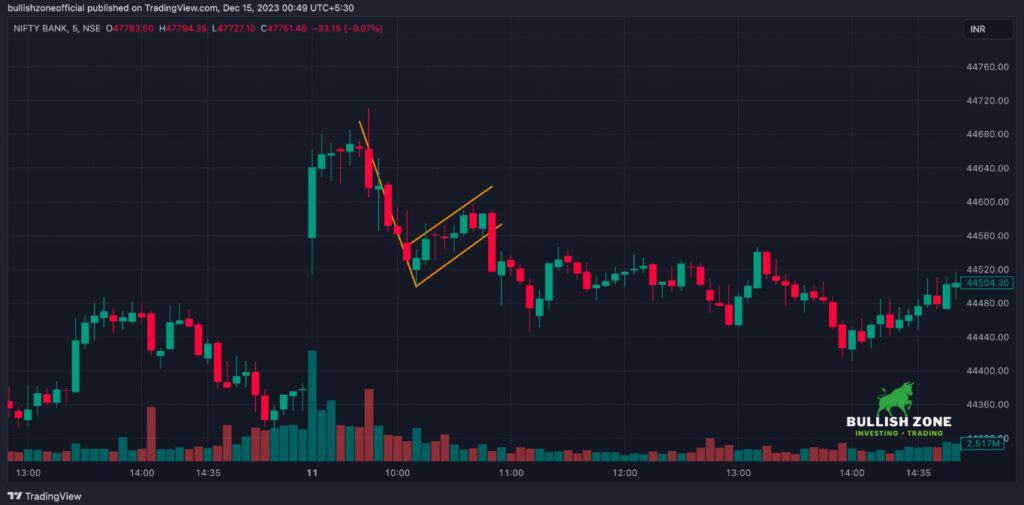
Once the channel breaks, the price again falls, and the downtrend continues.
7. Bearish Rectangle
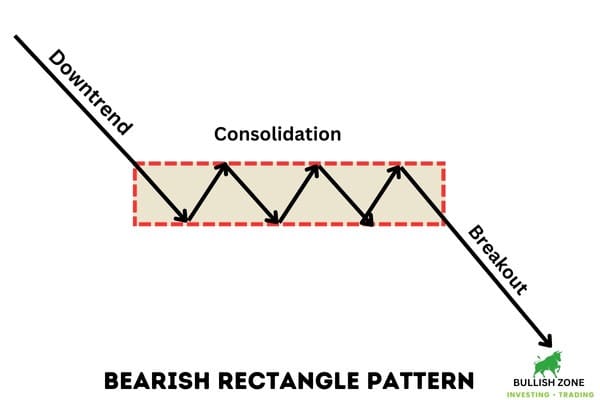
If the price consolidates between two horizontal lines, it forms a rectangle in which buyers and sellers equally fight.
The buyers exit their position once the market breaks the support line, and the price falls immediately.
Sometimes, the rectangle pattern gives a breakout in the upward direction and forms higher high and higher low price action, which indicates a trend reversal.
8. Inverse Cup and Handle
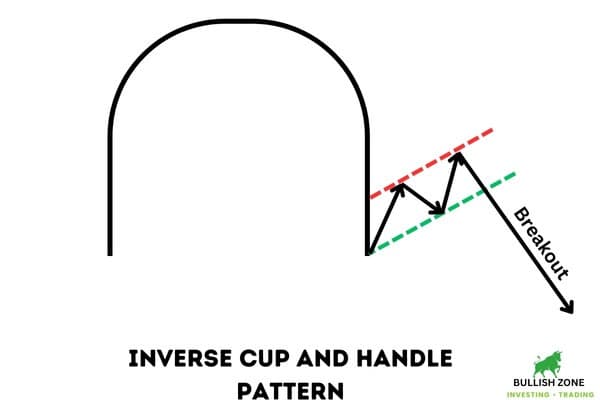
Cup and Handle is the most popular chart pattern in the stock market, and bank nifty often form this in a 5-minute timeframe.
If it formed at the bottom of the downtrend, it shows trend reversal. Check the example given below.
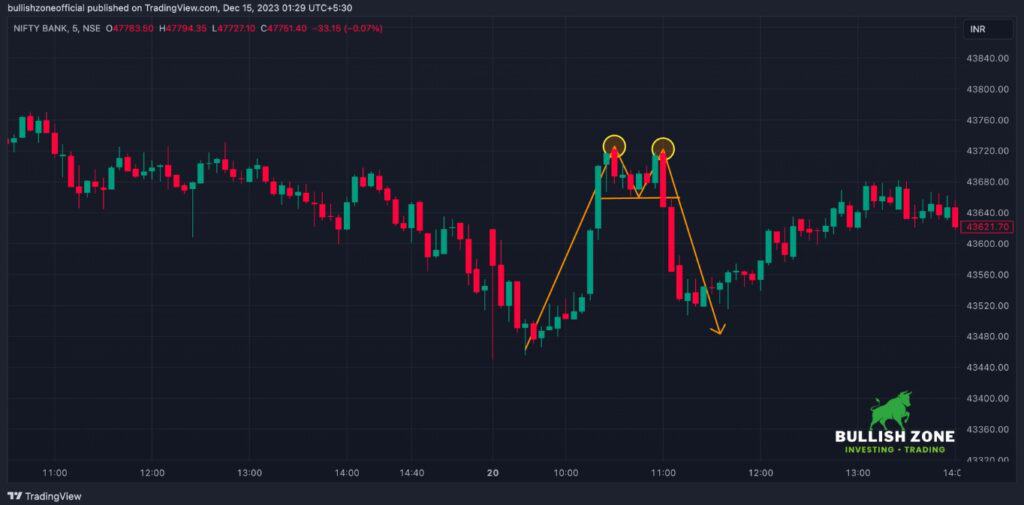
9. Double Top
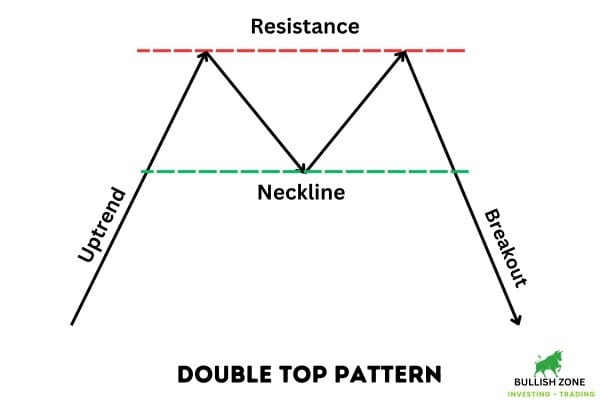
The double top is a bearish reversal pattern formed after a long upward rally. If the market forms a resistance line and the price is rejected twice from the same level, there are higher chances of a short downfall.
In the below example, you can see that the price is rejected twice from the same resistance level, and once the price breaks the neckline, a downfall continues.
Conclusion
These are some of the most profitable chart patterns in bank nifty for intraday FNO trading. In order to capture bigger profit, you must focus on risk management and quantity sizing. If you’re a beginner, observe these pattern formations on the live market and do paper trading for some days.